Online advertising is all about results and statistics. That is why reporting is so important. For campaign managers, it helps to take a step back on their daily work. For clients or managers, it’s the only way to understand how performs a campaign and discuss the results.
Reporting is a difficult exercise. Let’s have a look to what matter in a good Adwords report.
The choice of metrics
Metrics are the basis of an Adwords report. There are hundreds in Google Adwords – like clicks, impressions, CTR, conversions, cost per conversion, … – and most of them are used daily by campaigns managers to optimize the campaigns.
But, not all of them are interesting in a report. Focus only on the main ones depending on the business goals. A good Adwords report is one which gives the most valuable information to the reader.
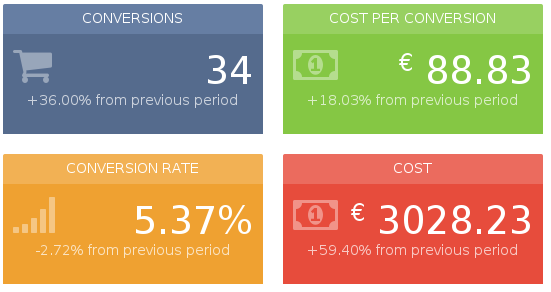
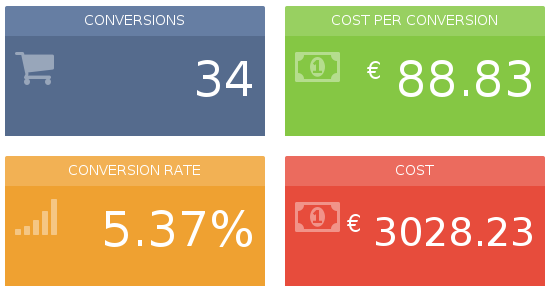
Almost any client wants to know how much they earn compared to how much it costs. If you can give them this data, your report can include for example cost per acquisition, number of conversions, the average value per conversion, the revenue and the cost.

Overview of your main Adwords metrics
But these metrics depends of the goals of the campaign. Take some examples:
- You manage a search campaign for an e-commerce shop. In this case, you can track conversions easily. You can monitor the entire purchase funnel and your report will include the number of conversions, the cost per acquisition, the conversion rate and the revenue.
- You manage a display campaign for a brand. The main purpose is to deliver brand messages to the biggest number of targeted people, not to convert. In this case, Impressions, Clicks and Click Through Rate will be very important. Even Impression Share could also find a place in your report.
A good report fits to your client’s needs, to the business market, to the goals of your campaign in a period which allows providing enough data.
Comparison with previous period for main metrics
The choice of the default period of the report is important. You need to have enough data to show a real trend in your metrics.
After having selected the right metrics, it’s important to measure the performance of your work. The best way is to compare your metrics with a previous period. Google Adwords offers this feature. Your reports have to do the same.
Comparing with the previous period
Most of time, you will compare with the previous period. For example, if you report every week, you will compare the selected week with the previous one. Same for monthly reporting. It allows monitoring the performances of the modifications you made on the campaign on a regular basis.
This information will be a percentage of evolution between the two periods.

Comparison with the previous period
Comparing with the same period of the previous year
There are specific periods where this rule doesn’t work. For seasoning business or Christmas period, it’s better comparing with the same period of the previous year.
These periods are so specific that using comparison with the previous week or month makes no sense. Any period in the year is similar to Christmas. If you launch your Christmas campaign, you will need to compare your metrics week after week with the ones of to the previous year.
Choose the right comparison period depending on the business and the market.
The evolution of the metrics on a longer period
Comparing with the previous period helps you to show the evolution of your campaign on a short term basis.
But online advertising is not a short term strategy. Strategy can take some month to show results. You need time and optimizations to get the best return on investment of your campaigns. You need to monitor the evolution on your main metrics on a longer period than the default period of the report.
For example, if you do monthly reporting and check the Cost Per Acquisition, it will be very interesting to show the evolution of this metric on a yearly basis.
A line chart fits well this kind of evolution. An interesting chart could be to show the evolution of two important metrics – Revenue and Total Cost for example – on a yearly period. The reader can see in one look the evolution of his campaign and his main metrics.

Evolution of your Adwords metrics on a longer period
Showing evolution on a longer period in your report helps the reader to monitor the efficiency of the online advertising strategy.
The geolocation report and global communication
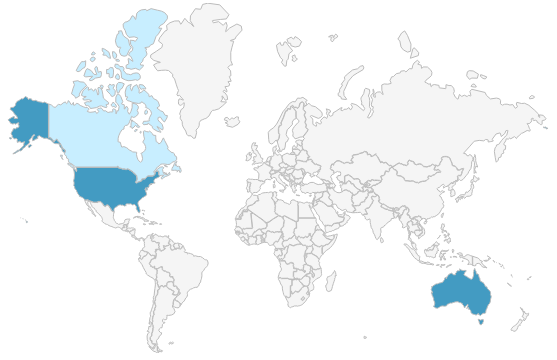
Google Adwords allows a really accurate geo targeting. You can target specific countries, regions, cities, zip code or even GPS coordinates.
Geolocation report is interesting because it gives valuable data for the global communication of the company.
For example, you work for a hairdressing salon. You target an area of 30km around the shop. With a geolocation report, you can see precisely the cities where people are looking for your service.
If the hairdresser wants to make a flyers campaign, he knows where to leave his flyers.
It’s the same for a national company which has a limited budget for its exhibitions. With geolocated data from his Adwords campaign, the boss of the company can choose the best exhibition spots where to invest his money.

Adwords Geolocation
Geolocation report doesn’t only provide data to optimize online campaign. It provides data to enhance your offline campaigns too.
Data without analysis is worthless
Last tip and surely one of the most important: analysis.
Analysis must be a main part of your report and be present nearly for each metrics you put in. If I take the previous sections of the report we talked about, you need at least analysis after each section.
Your client or your manager trusts you to make the best campaign for the best return on investment. He’s maybe not familiar with online advertising and Google Adwords.
That’s why your analysis is important. Explain why it’s better to have fewer clicks but more conversions, why you raise a bit the cost per click to compete on targeted keywords which have a good conversion rate, why the cost per clicks is higher because a competitor wants to fight, why you raise your bids some days or hours.
Everybody is going to see the cost per acquisition and the return on investment in your report. But the other data can explain your daily work, your strategy, the evolution and the correlation between all the metrics.
Imagine you have a profitable campaign. Your client is happy but you can improve the campaign. The budget is limited. You can explain to your client why it’s a good thing to improve the budget even he thinks it’s too much.
In the opposite, you can explain why you think it’s not a good opportunity for him to continue to bid on some thematic or keywords which don’t convert.
As a campaign manager, reporting is a main part of the relationship you have with your clients. This relationship can’t only be based on metrics in datatable and geomap. They deserve to understand what you are doing and why you are doing it.
Conclusion
Adwords reporting is not an exact science. Each business market, client and business strategy needs a specific report to show the results of the campaigns.
There is plenty of metrics you can add to your reports but you have to focus on the ones which matter for the reader. Your reporting reflects your work, the analysis your knowledge. The report must also show the next step of your strategy to continue to improve the campaign and the return on investment.
Feel free to discuss about your reporting tips and use cases.


