5 metrics to include in your Adwords reporting

comparison-previous-period-adwords-reporting

Online advertising is all about results and statistics. That is why reporting is so important. For campaign managers, it helps to take a step back on their daily work. For clients or managers, it’s the only way to understand how performs a campaign and discuss the results.

Reporting is a difficult exercise. Let’s have a look to what matter in a good Adwords report.

The choice of metrics

Metrics are the basis of an Adwords report. There are hundreds in Google Adwords – like clicks, impressions, CTR, conversions, cost per conversion, … – and most of them are used daily by campaigns managers to optimize the campaigns.

Read More

Impression share report to improve your Google Adwords campaigns

Impression share report is an underrated report. Be wiser than your competitors and use it to find powerful leverages to increase your Adwords campaign performances.

What is impression share report ?

Impression Share is the number of impressions your campaign received divided by the estimated number of impressions it could have received. The estimation is based on several parameters like geolocation, audience, bids, quality score, …

impression-share-sunnyreports

What is Impression share

Having a look at the picture above, you can quickly understand how useful this data is:

increase the part of your impression share => more “targeted people” see your ads.

There is four types of Search Impression Share (IS) metrics available for search campaign:

    • Search impression share: this is the impressions your ads received on the Search Network divided by the estimated number of impressions they may have received,
      • Search Lost IS (budget): This is the share your ads lost due to an insufficient budget. This metric is only available at the campaign level.
        • Search Lost IS (rank): this is the share your ads lost due to a poor ad rank.
          • Search Exact match IS: the total of impressions your ads received only for the keywords exact match relative to what they could have received.

          There is also similar metrics for Display campaign: Display impression share, Display Lost IS (budget), Display Lost IS (rank).

          Why using it ?

          Read More

          Google Analytics Treemaps For AdWords Reporting

          Google Analytics is going to improve his Google Adwords reporting features by adding a new feature called Treemaps. The information is coming from Google+ “Introducing Treemaps in Google Analytics for Adwords Insight“.

          What is Treemaps ?

          Treemaps will offer to Adwords campaign managers a better insight of the performances of their ads. The approach is not to only have look to numbers but to visually identify the trends or troubles.

          It’s done by displaying hierarchical data using nested rectangles, showing positive results in green, lagging results in red. It aims to speed the decision process and to optimize better and quicker the campaigns.

          It’s a really interesting improvement in the ad performances analysis. Treemaps will be available in the next weeks in Google Analytics in Acquisition > Adwords > Treemaps.

          How to use Google Adwords “Compare date ranges” feature to monitor metrics evolution

          compare-period-options adwords sunnyreports

          SunnyReports allows now to add comparison metrics in your Adwords reports. Back on compare date ranges feature, a great way to make a deep analysis in your daily work as an Adwords campaign manager.

          What is “compare periods” feature in Adwords?

          Within Adwords, you can easily select the period for which you want data. But it’s interesting to be able to monitor the evolution of these data. To do that, you can compare the selected period to another one. Adwords proposes you three different possibilities.

          compare-date-ranges-adwords

          Previous period

          With this option, you can compare the selected period with the immediately previous one.

          Examples:

          • Select the period from April 1, 2014 to April 30, 2014. By comparing to previous period, the secondary period will be from March 2, 2014 to March 31, 2014.
            Note it will not compare from the 1st of March but from the 2nd of March. That’s because the reference period is only 30 days long, not 31 days.
          • Select the period from June 14, 2014 to June 19, 2014. The secondary period will be from June  8, 2014 to June 13, 2014.
          If you select “Current month”, you have to take care that Google Adwords can compare two periods which have not the same number of days. Indeed, if you are the August, 11, “Current month” corresponds from the August, 1 to August, 11. But if you compare with “previous period”, it will be compared to Juy, 1 to July, 31.

          Same period, Previous year

          With this option, the compared period will be the same exact period a year before.

          • Say you select from May 4, 2014 to June 13, 2014. The compared period will be May 4, 2013 to June 13, 2013.
          There is an exception here: february. February is a special month. During leap year, February counts 29 days instead of 28 the other year. Adwords takes care of it.
          • Select the period from the February 1, 2012 (a leap year) to the February 29, 2012. Choose comparison to “same period, previous year”. You will notice the date selected by Adwords: February 1, 2011 to February 28, 2011. Google’s developers think about everything!

          Custom Period

          Select the secondary period you want precisely. That’s it.

          How to use it ?

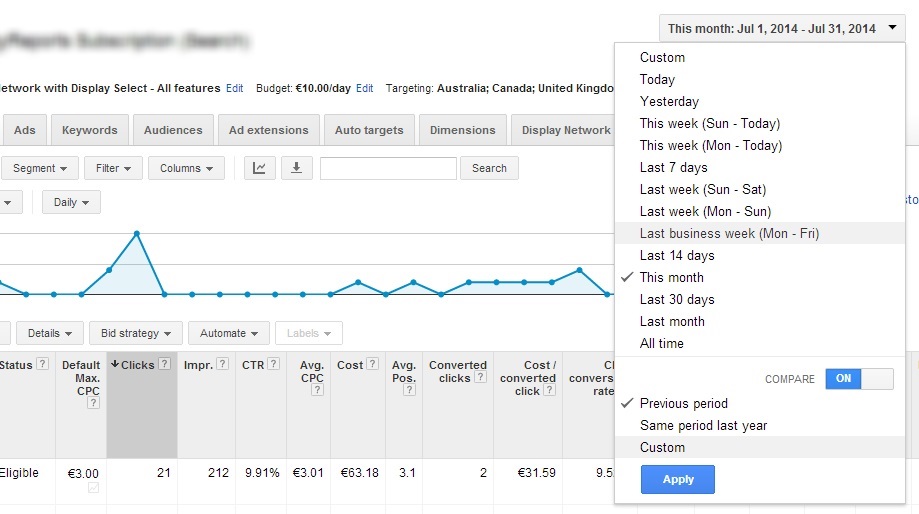
          Adwords is sometimes complicated with plenty of menus, options, features, … But not with the “compare date ranges” feature. Everything is done in one click.

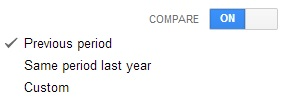
          No matter on which view you are. Just click in the period select field. At the bottom, you will see a “COMPARE” label with a trigger. Push the trigger and the three periods options will appear.

          1. Select the one you want and apply.

          compare-period-options adwords sunnyreports

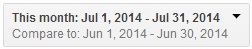
          2. The period select field now show you are comparing two periods, and calculate the dates of the compared one.

          compare-period-select-field

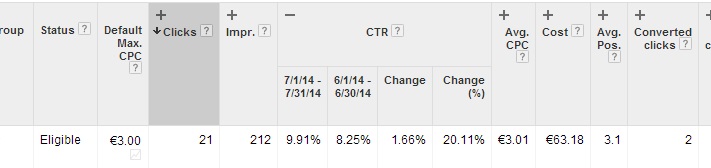
          3. In the datatable, you have now a “+” sign above each head column titles.

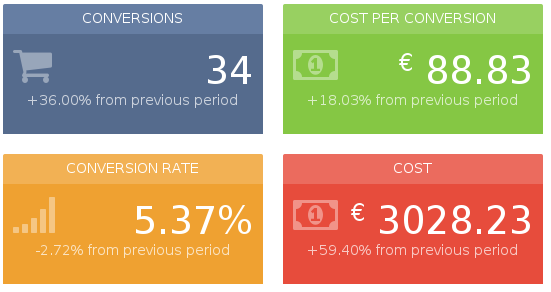
          Click on each “+” sign to show the data for the secondary period. For the selected KPIs,  you will have:

          • the metric for the reference period,
          • the metric for the compared period,
          • the difference between the two and
          • finally the % of increase or decrease.

          compare-date-ranges-metrics

          Read More