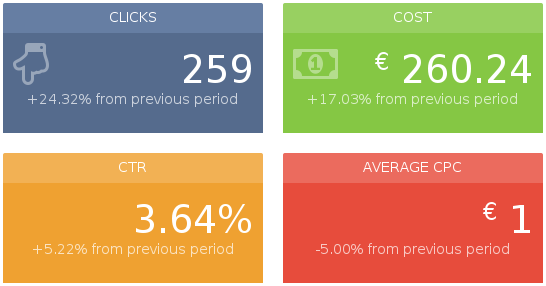
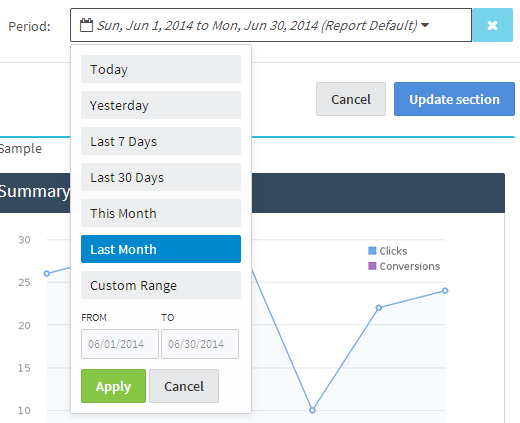
Your reports have to show the time evolution of the performances of the Google Adwords campaign. For this, we recently introduce the ability to add custom time period into a section of your Adwords reports for clients.
Now, you can compare time periods!
Adwords performance reports must show performance. Obvious, isn’t it ? But what does it mean for your reports ? How to do that ?
For an Adwords campaign, performance is first based on the ROI (Return on Investment) – the money you spend versus the money you earn. Google Adwords is interesting only if profitable.
But it’s important to follow all the metrics – average CPC, CTR, cost, clicks, conversion, cost per conversion. It’s even better to follow their evolutions. That’s why we introduce the ability to compare two time periods.
To stay consistent and simple, we have followed how it works in Google Adwords. You can find below the two possibilities of time period comparison.
Compare with the previous period
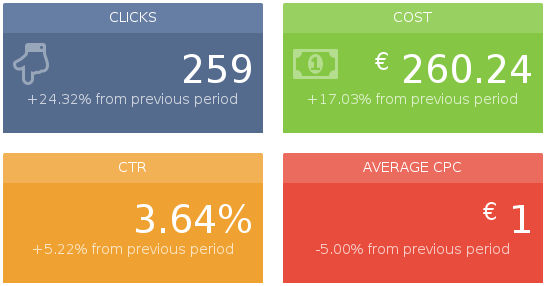
By selecting this comparison, you can compare a time period to the previous one, exactly like in Google Adwords.
Examples:
- The period selected is from the June, 1st 2014 to 30, june 2014. The metrics will be compared to 2nd may 2014 to 31 may 2014.
You must note that May will not be complete. As there is 30 days in june, the metrics will be compared to the last 30 days of may. So it begins at the second.
- If you select a period from the tuesday, june 24, 2014 to friday, june 27, 2014, the metrics will be compared to friday, june 20, 2014 to monday, june 23, 2014. The period is four days long. The period to be compared is four days long and finishes the day before the first day of the default period.




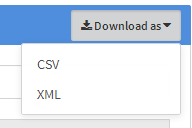 You just have to select which format you want for the data and the file is downloaded automatically.
Signup For Access To Free Google Adwords Tips & Resources
Join our mailing list to receive the latest news and updates from our team.
You have Successfully Subscribed!