SunnyReports allows now to add comparison metrics in your Adwords reports. Back on compare date ranges feature, a great way to make a deep analysis in your daily work as an Adwords campaign manager.
What is “compare periods” feature in Adwords?
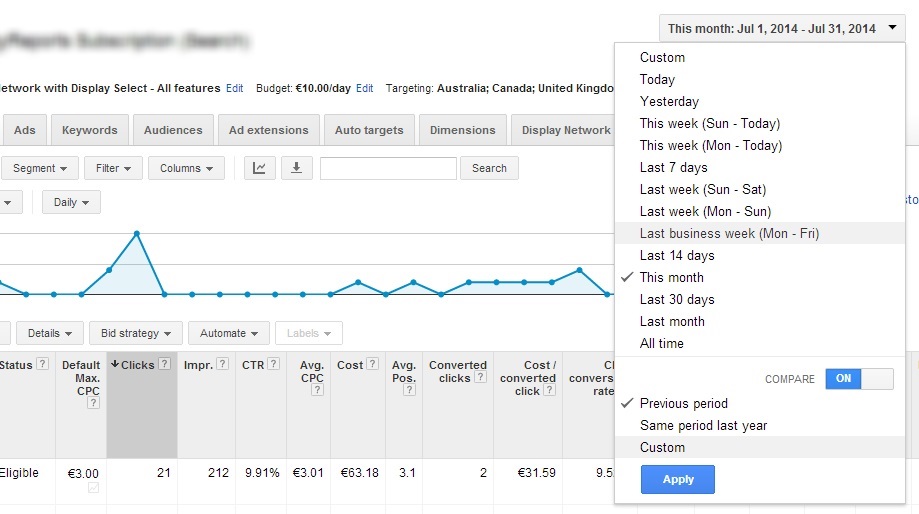
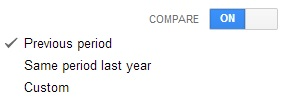
Within Adwords, you can easily select the period for which you want data. But it’s interesting to be able to monitor the evolution of these data. To do that, you can compare the selected period to another one. Adwords proposes you three different possibilities.
Previous period
With this option, you can compare the selected period with the immediately previous one.
Examples:
- Select the period from April 1, 2014 to April 30, 2014. By comparing to previous period, the secondary period will be from March 2, 2014 to March 31, 2014.Note it will not compare from the 1st of March but from the 2nd of March. That’s because the reference period is only 30 days long, not 31 days.
- Select the period from June 14, 2014 to June 19, 2014. The secondary period will be from June 8, 2014 to June 13, 2014.
Same period, Previous year
With this option, the compared period will be the same exact period a year before.
- Say you select from May 4, 2014 to June 13, 2014. The compared period will be May 4, 2013 to June 13, 2013.
- Select the period from the February 1, 2012 (a leap year) to the February 29, 2012. Choose comparison to “same period, previous year”. You will notice the date selected by Adwords: February 1, 2011 to February 28, 2011. Google’s developers think about everything!
Custom Period
Select the secondary period you want precisely. That’s it.
How to use it ?
Adwords is sometimes complicated with plenty of menus, options, features, … But not with the “compare date ranges” feature. Everything is done in one click.
No matter on which view you are. Just click in the period select field. At the bottom, you will see a “COMPARE” label with a trigger. Push the trigger and the three periods options will appear.
1. Select the one you want and apply.
2. The period select field now show you are comparing two periods, and calculate the dates of the compared one.
3. In the datatable, you have now a “+” sign above each head column titles.
Click on each “+” sign to show the data for the secondary period. For the selected KPIs, you will have:
- the metric for the reference period,
- the metric for the compared period,
- the difference between the two and
- finally the % of increase or decrease.


Signup For Access To Free Google Adwords Tips & Resources
Join our mailing list to receive the latest news and updates from our team.
You have Successfully Subscribed!